> ## Documentation Index
> Fetch the complete documentation index at: https://docs.mutagent.io/llms.txt
> Use this file to discover all available pages before exploring further.
# Trace viewer
> /trace — a read-only viewer over your session logs: list sessions, open one, walk its trajectory. Available in every mode.
`/trace` opens a viewer over the session logs on your machine — Helix sessions and, where present,
plain Pi and Claude Code sessions too. Pick a session and walk it: step by step, or as a waterfall
of real durations. It is read-only — nothing in it re-runs, steers, deletes, or writes to
a session file — which is what makes it safe to open on a live run. It works in every mode.
```bash theme={null}
helix # then type: /trace
```
Looking for where **Evaluate** reads its evidence? That's [Traces](/helix/traces) — a different
thing that shares the name.
 ## Screens
| Screen | Shows |
| -------------------- | -------------------------------------------------------------------------------------------------------------------------------------------------------------------------------------------------------------------------- |
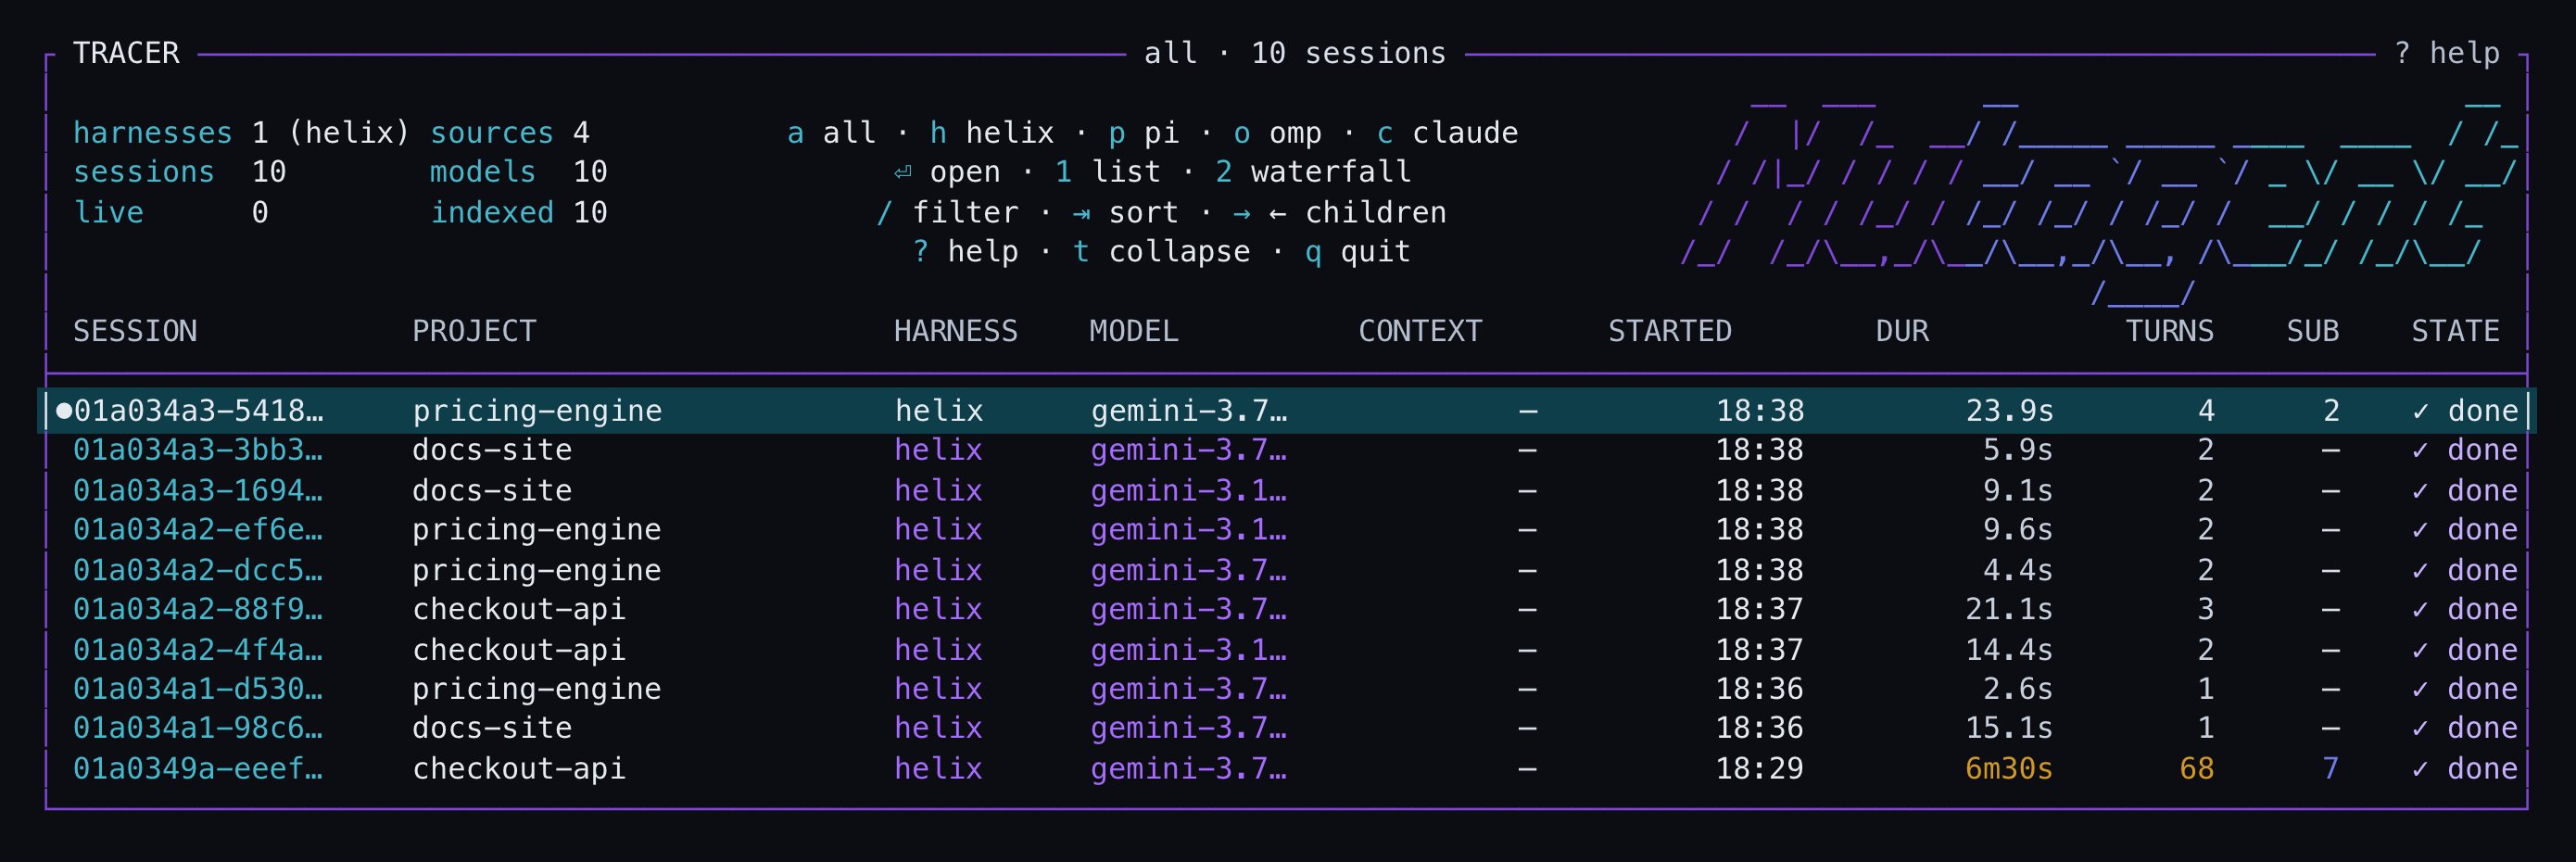
| **Sessions** | Every session across every harness that writes logs, one row each: harness, model, duration, turns, context used, sub-agent count. Press `2` for **lanes** — every session as a bar aligned at t=0 — and `1` to come back. |
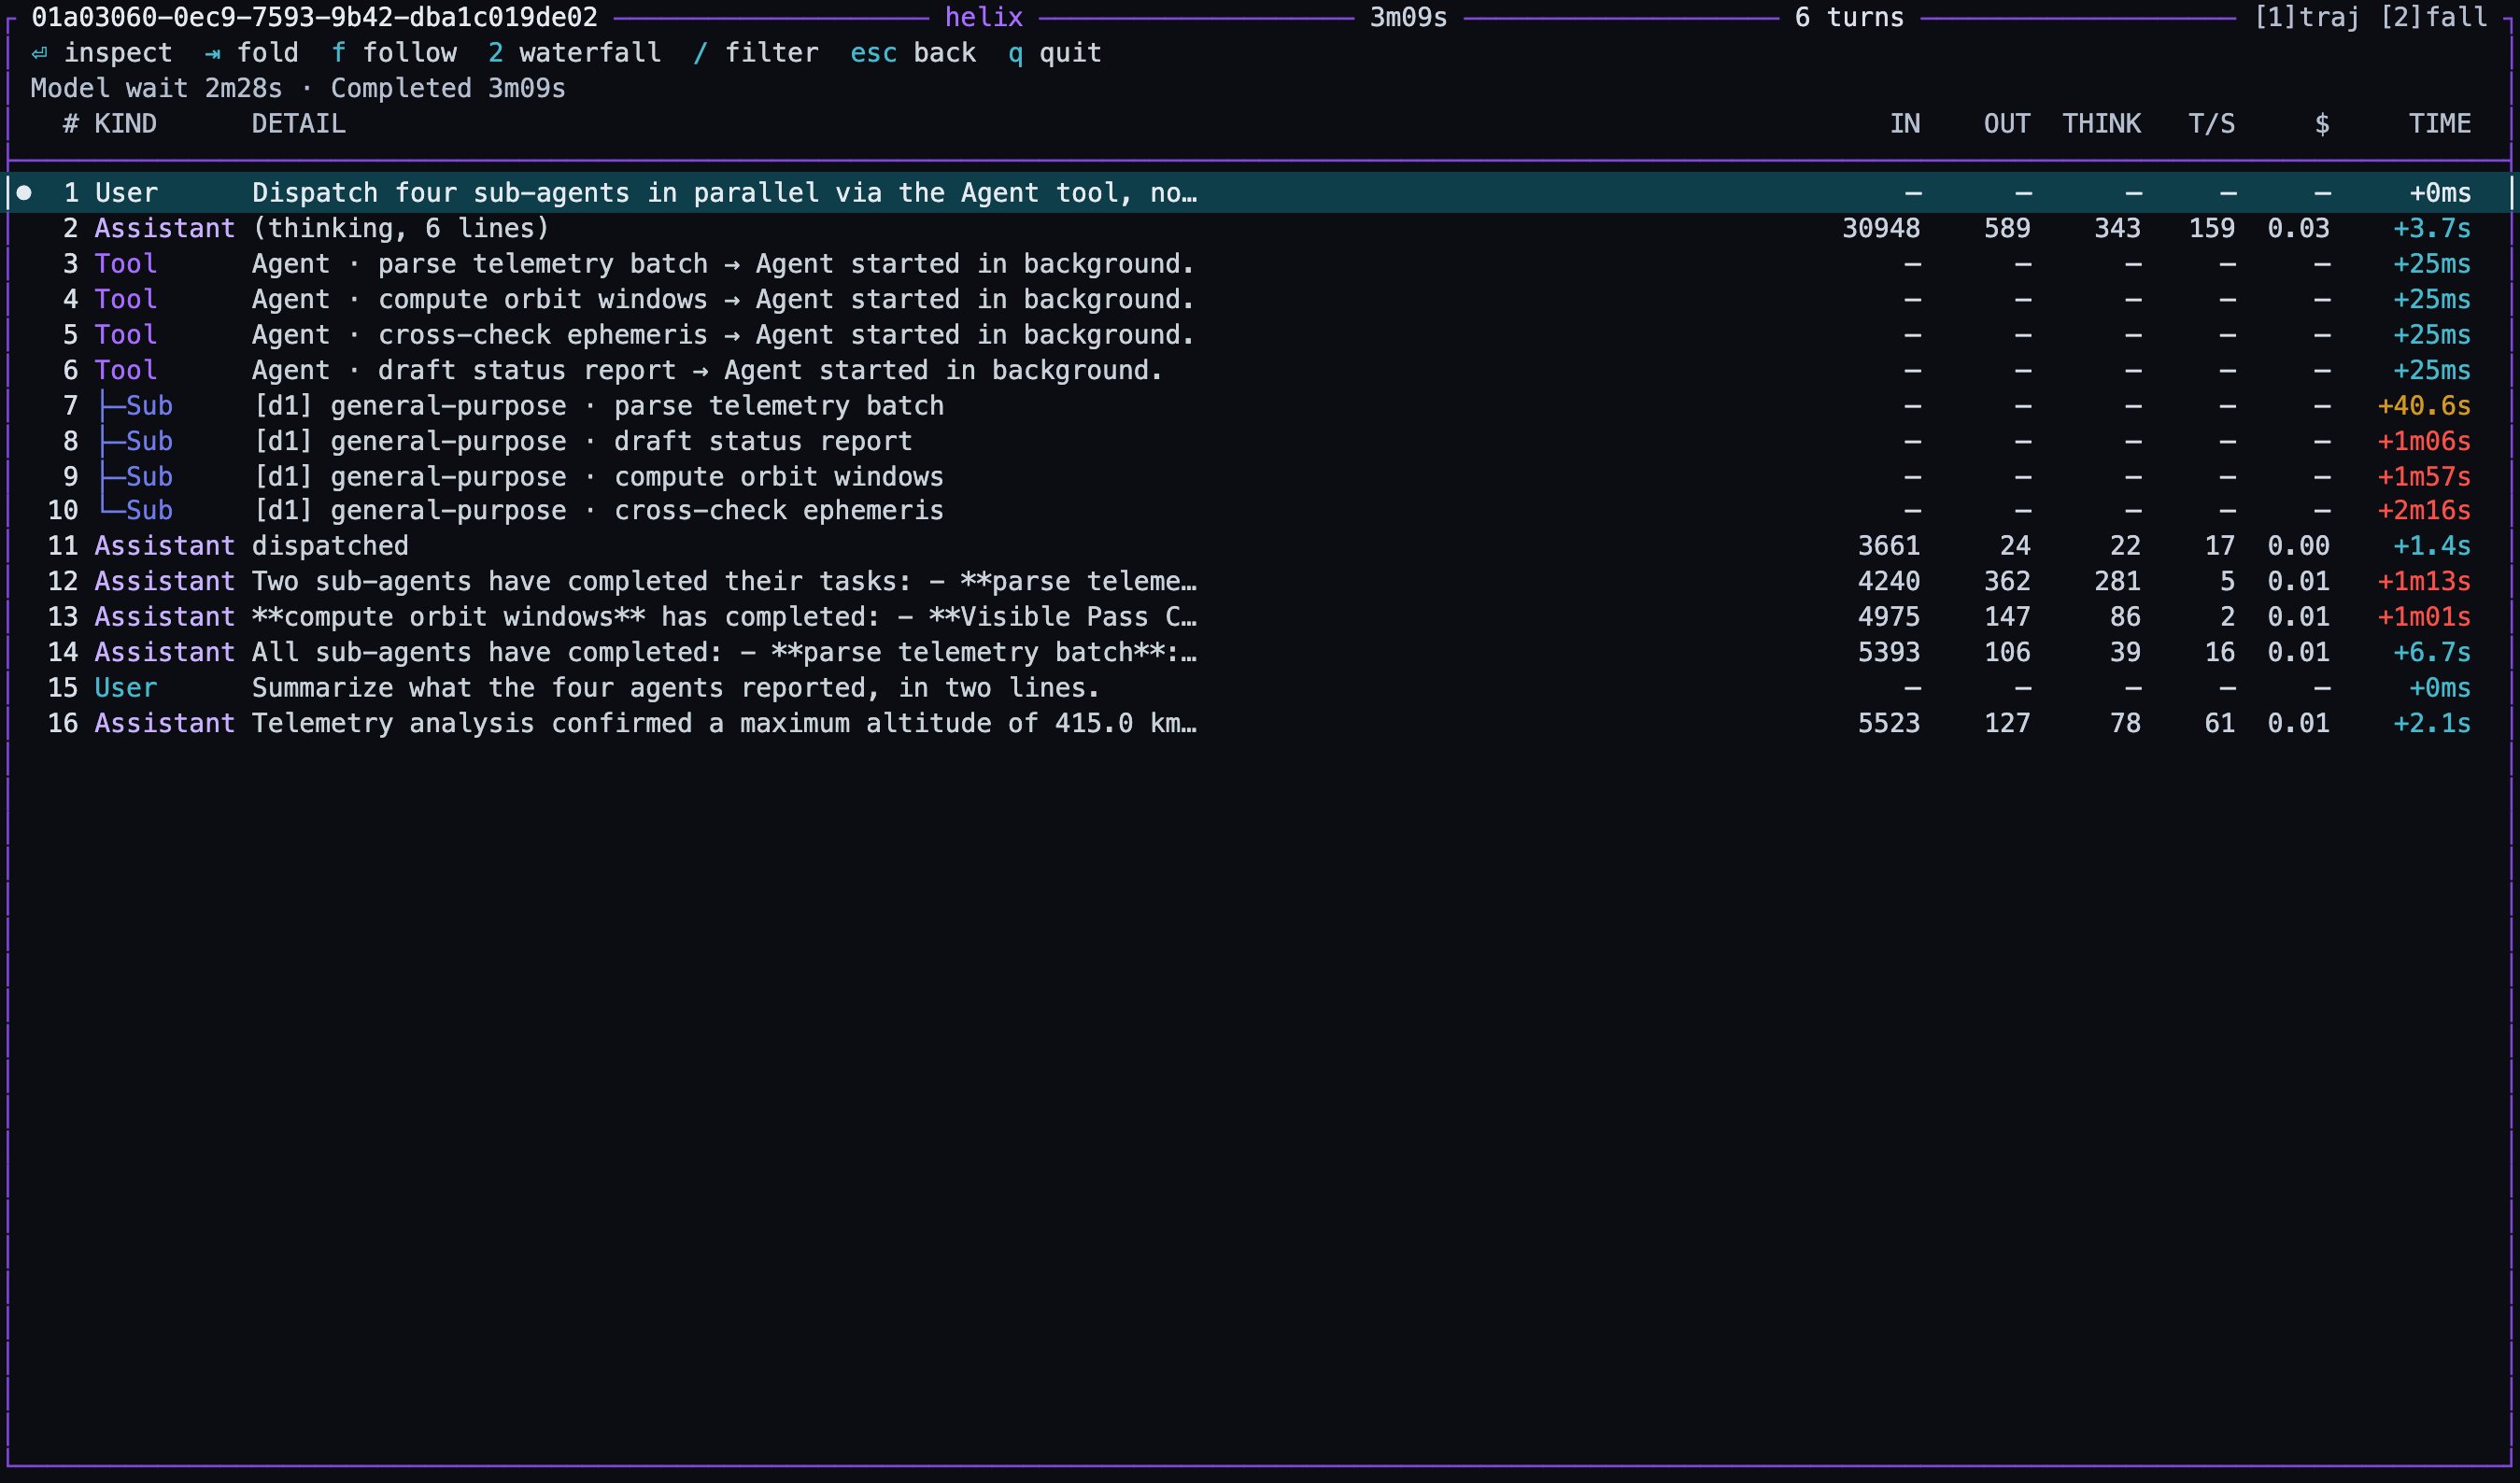
| **Trajectory** (`1`) | The selected session step by step — messages, tool calls, sub-agent dispatches. What your agents *did*, not what they said they did. |
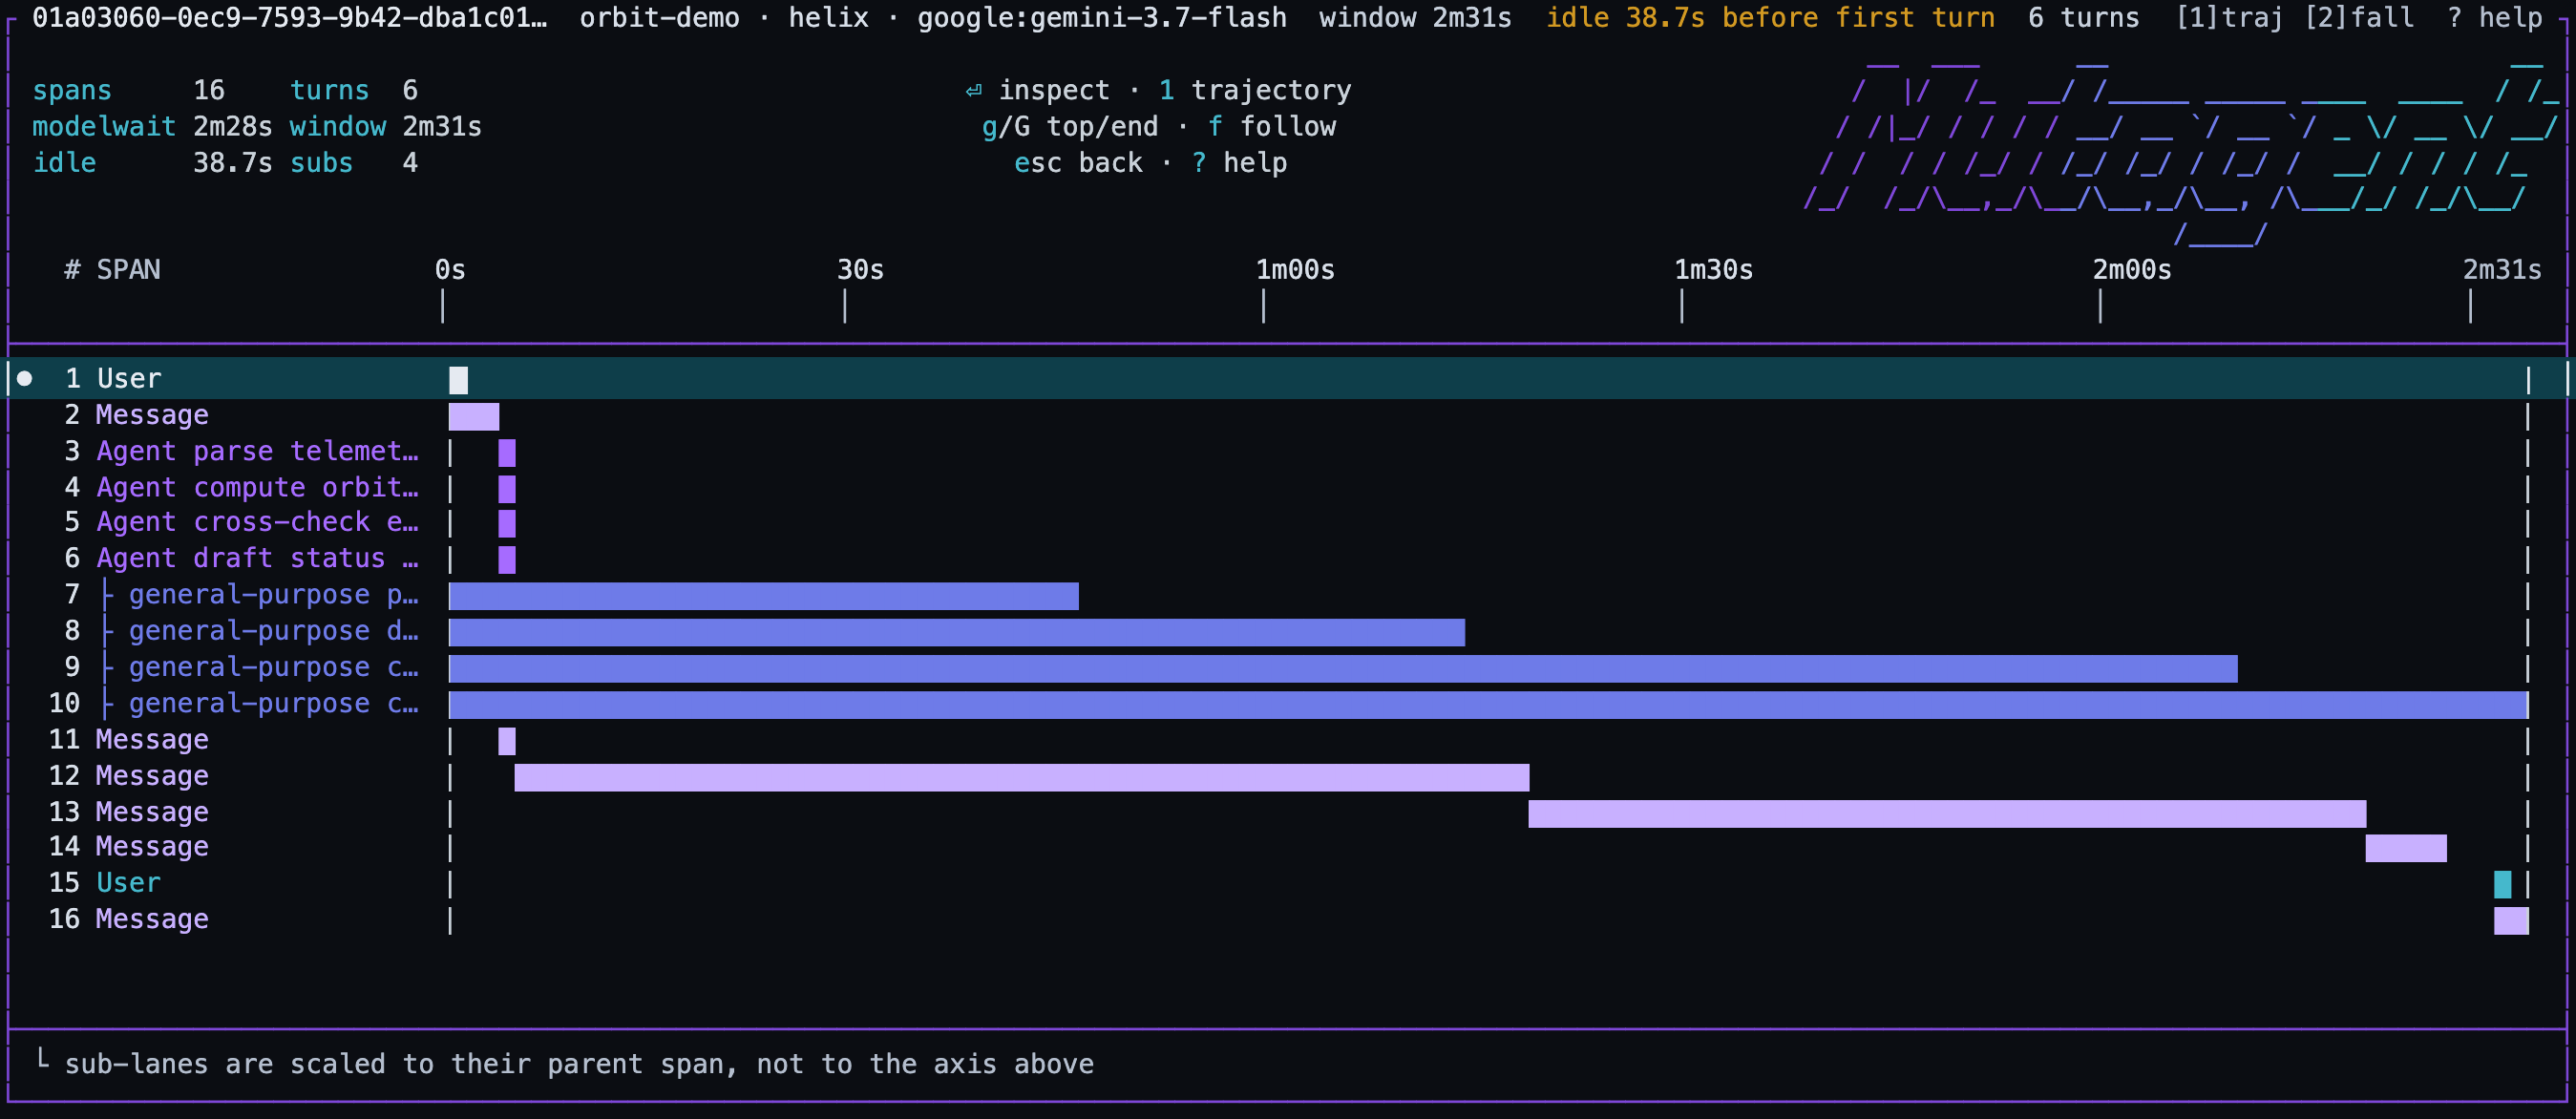
| **Waterfall** (`2`) | The same session as timed spans, with real per-step durations — what ran long, what waited on what. |
| **Inspect** | One span in full; `←`/`→` (or `h`/`l`) step to the previous / next span without leaving. |
## Screens
| Screen | Shows |
| -------------------- | -------------------------------------------------------------------------------------------------------------------------------------------------------------------------------------------------------------------------- |
| **Sessions** | Every session across every harness that writes logs, one row each: harness, model, duration, turns, context used, sub-agent count. Press `2` for **lanes** — every session as a bar aligned at t=0 — and `1` to come back. |
| **Trajectory** (`1`) | The selected session step by step — messages, tool calls, sub-agent dispatches. What your agents *did*, not what they said they did. |
| **Waterfall** (`2`) | The same session as timed spans, with real per-step durations — what ran long, what waited on what. |
| **Inspect** | One span in full; `←`/`→` (or `h`/`l`) step to the previous / next span without leaving. |
 ## Keys
| Key | Does |
| ----------------- | ------------------------------------------------------------------------------- |
| `↑` `↓` · `j` `k` | Move. `PgUp`/`PgDn` jump ten; `g`/`G` top / bottom. |
| `Enter` | Open the selected session or span. |
| `→` · `←` | On Sessions: fold a session's sub-agent children out and back. |
| `1` · `2` | Swap between the dense view and the timing view of whatever you are looking at. |
| `Esc` | Back one level (on Sessions, clears the filter first). Never quits. |
| `?` | Key help. |
| `q` | Close the viewer. |
## Keys
| Key | Does |
| ----------------- | ------------------------------------------------------------------------------- |
| `↑` `↓` · `j` `k` | Move. `PgUp`/`PgDn` jump ten; `g`/`G` top / bottom. |
| `Enter` | Open the selected session or span. |
| `→` · `←` | On Sessions: fold a session's sub-agent children out and back. |
| `1` · `2` | Swap between the dense view and the timing view of whatever you are looking at. |
| `Esc` | Back one level (on Sessions, clears the filter first). Never quits. |
| `?` | Key help. |
| `q` | Close the viewer. |