

/trace opens a viewer over the session logs on your machine: Helix sessions and, where present,
sessions of other coding agents (Claude Code, Codex, and the open-source coding agents Pi and Oh My
Pi). Pick a session and walk it: step by step, or as a waterfall
of real durations. It is read-only — nothing in it re-runs, steers, deletes, or writes to
a session file — which is what makes it safe to open on a live run. It works in every mode.
Looking for where Evaluate reads its evidence? That’s Traces — a different
thing that shares the name.
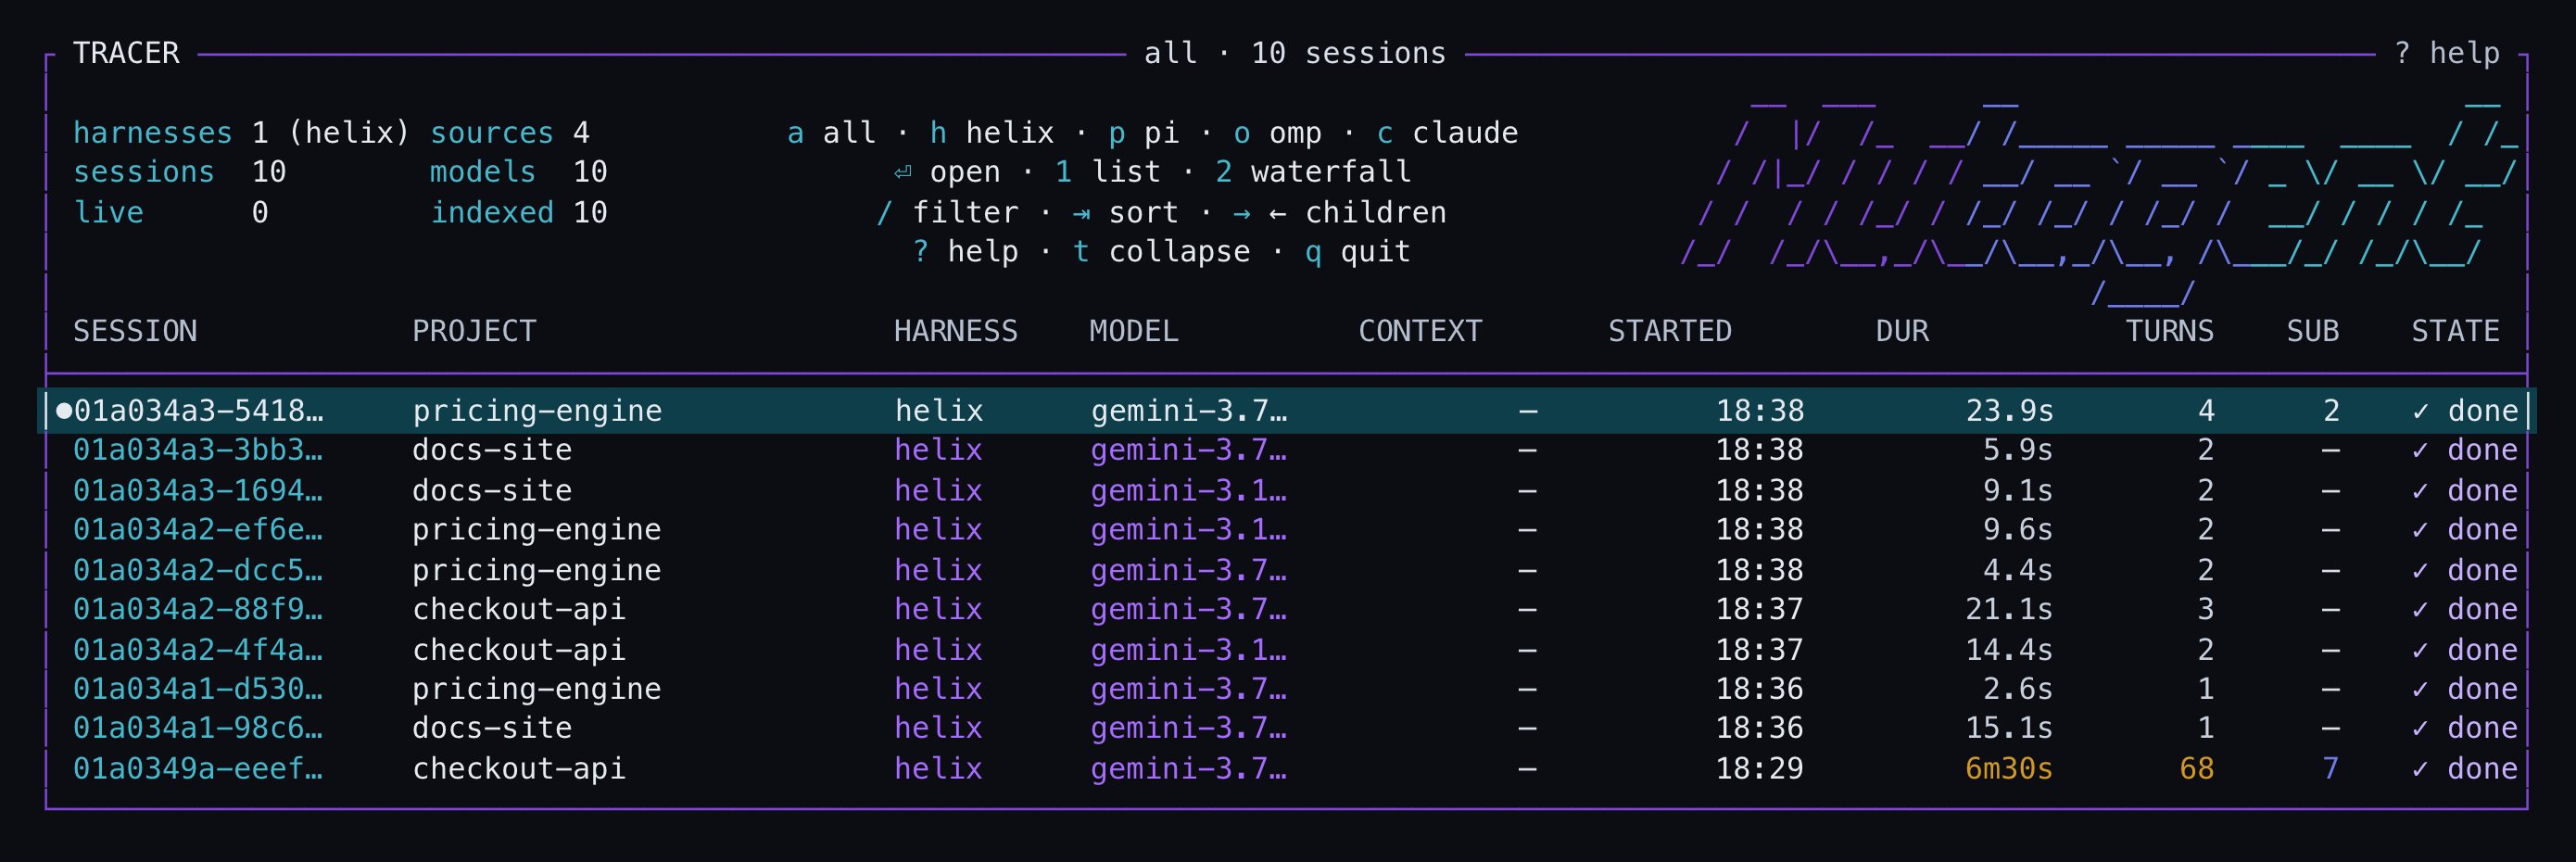
Where /trace opens: every session on the machine, one row each — project, harness, model, duration, turns and sub-agents.
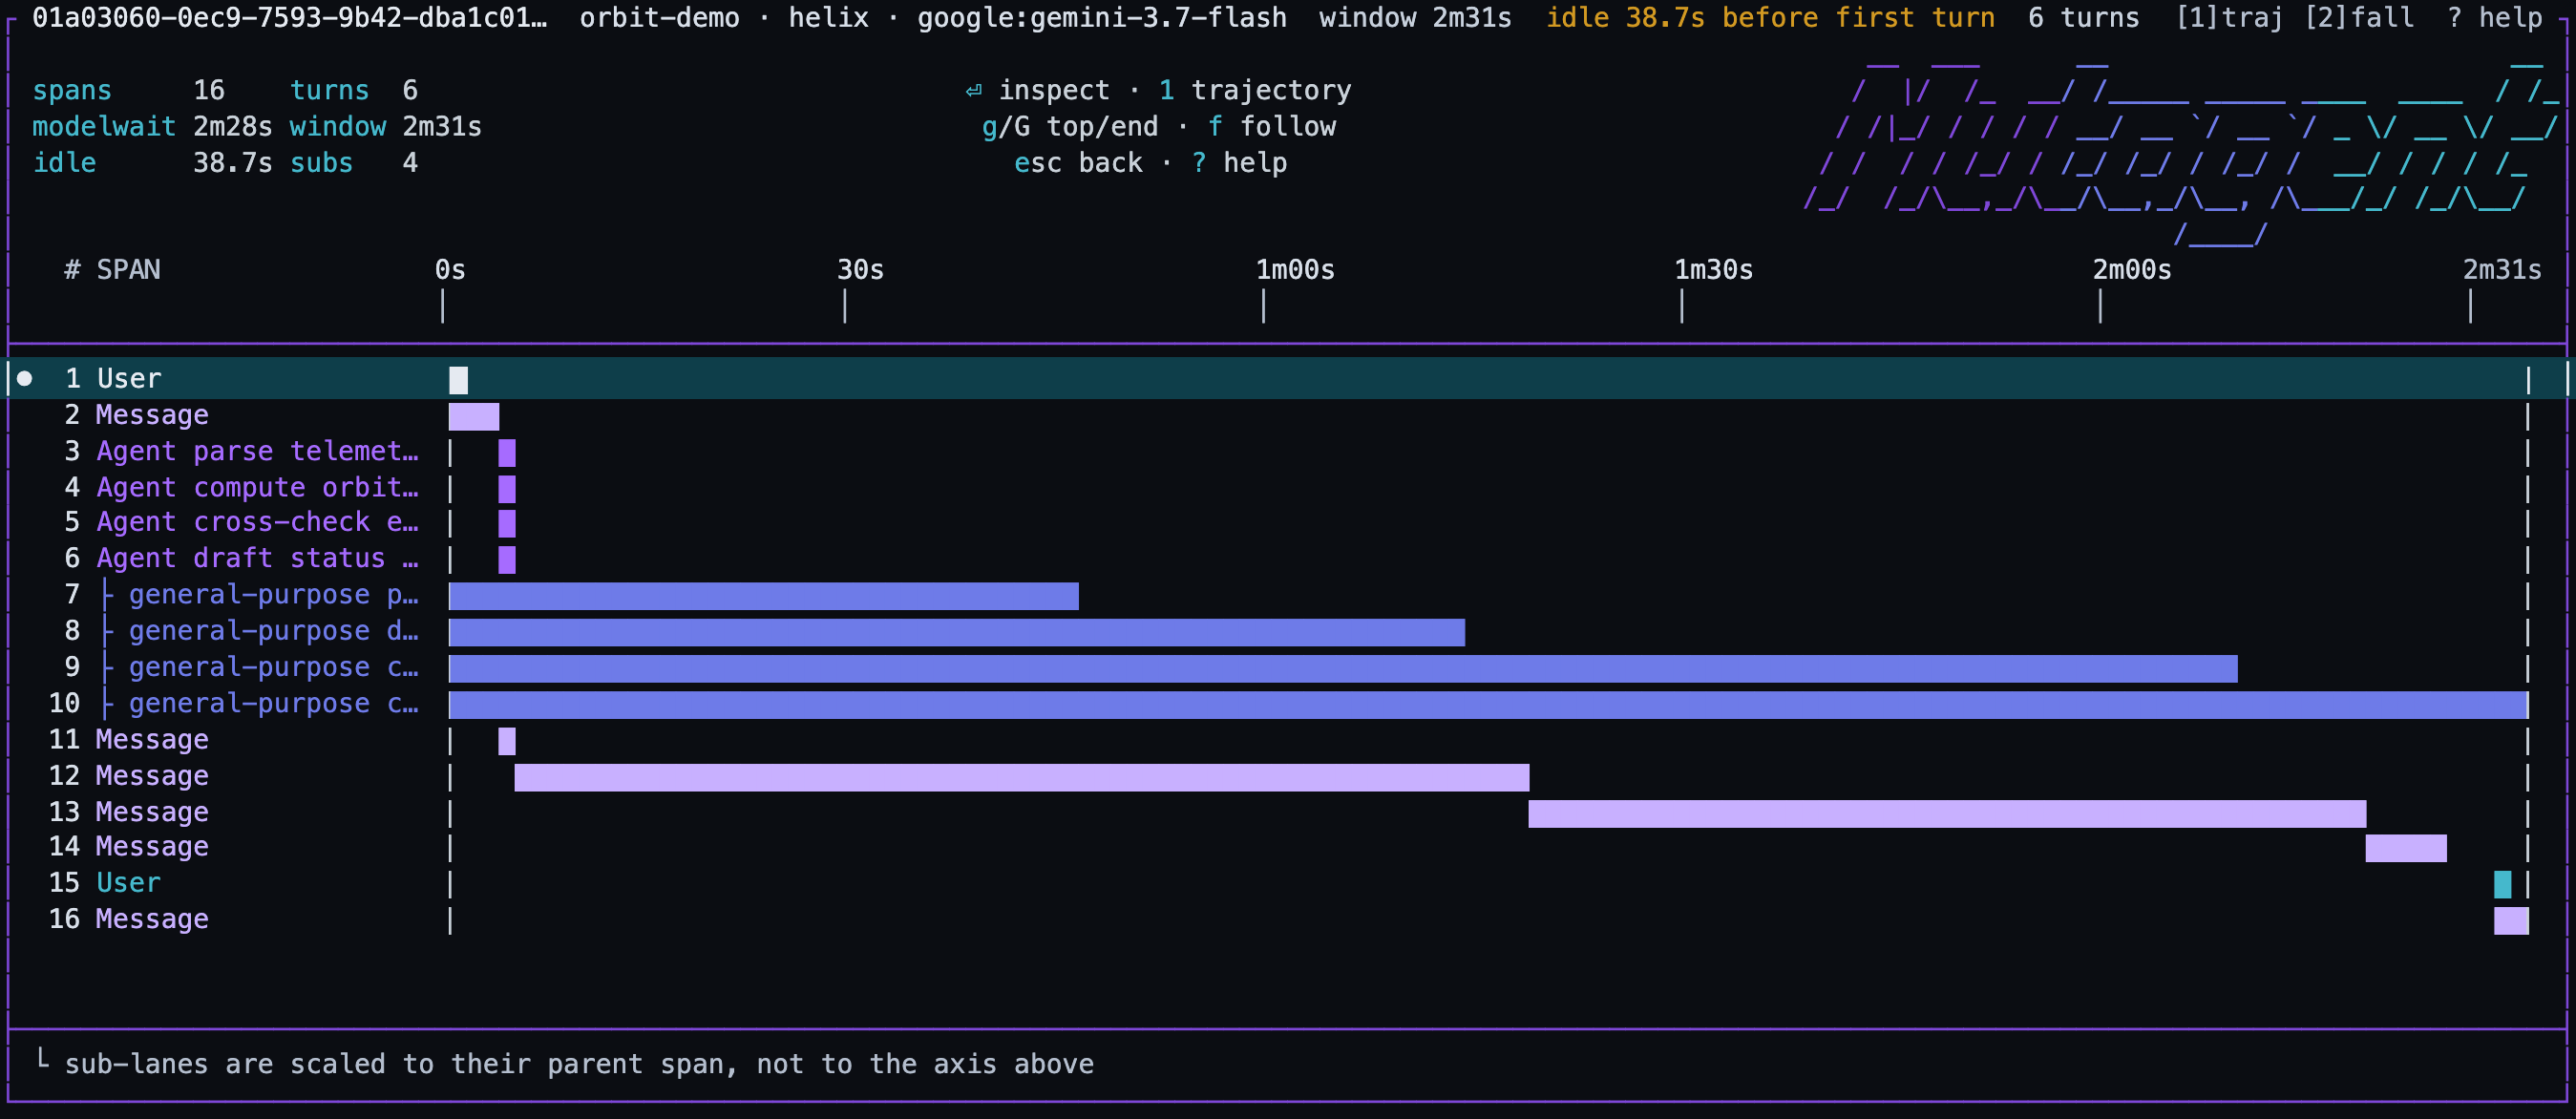
The waterfall: four sub-agents dispatched in parallel, each lane a real duration — what ran long, what waited on what.
Screens
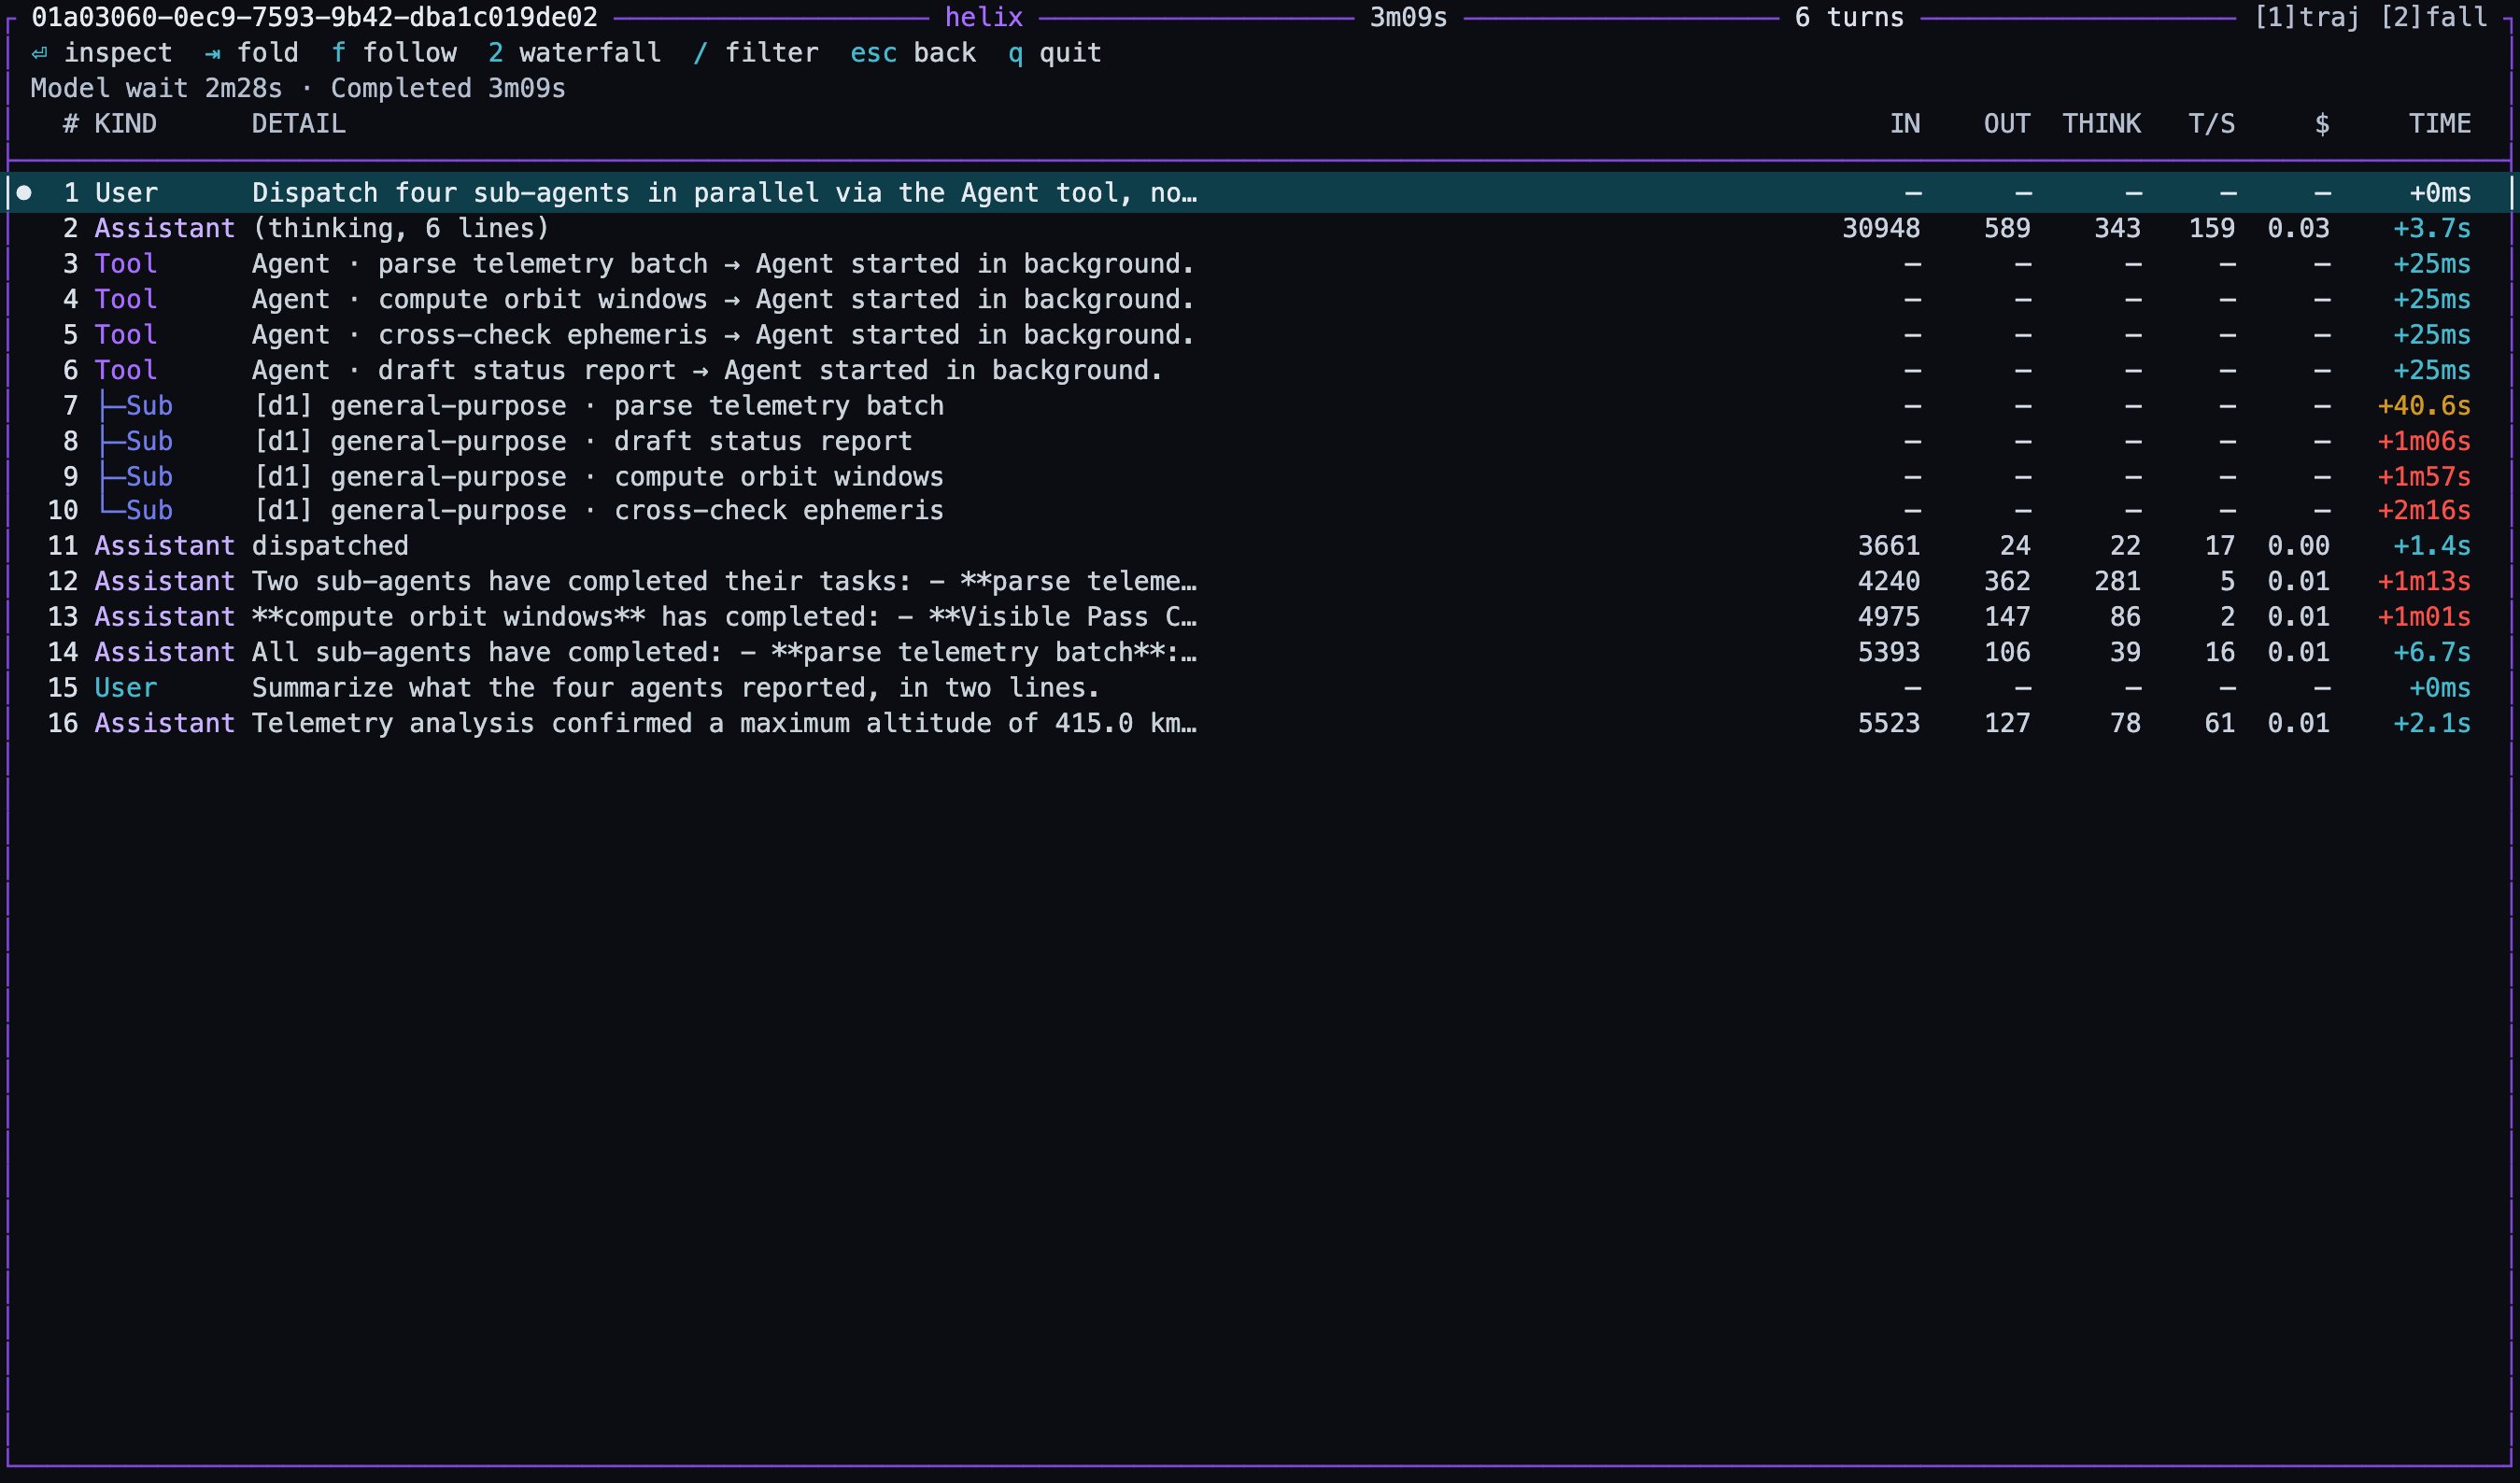
The trajectory: the same session step by step — dispatches, sub-agent rows, and per-step tokens, cost and timing.